Red vs Green vs Blue V2 - Benchmark Software
As per the first version of this article, I was keen to run benchmarking software over all the possible setup combinations to see how they performed, so they could be compared to each other and their respective setup costs. I chose Futuremark 3D Vantage, as I have used this before successfully and it tells me how the systems are performing compared to expected results. This runs at a set resolution of 1280x1024 regardless of your monitor setup. The software looks at your hardware profile and sets a target score that it expects your system to achieve, so you can assess how healthy your system is.
I knew from Red vs Green vs Blue Version 1 that Nvidia had some serious performance issues when running benchmarks from a Surround desktop. The 290 series drivers were used for these tests. Nvidia claimed it had fixed this in the 301 series drivers so I put it to the test.
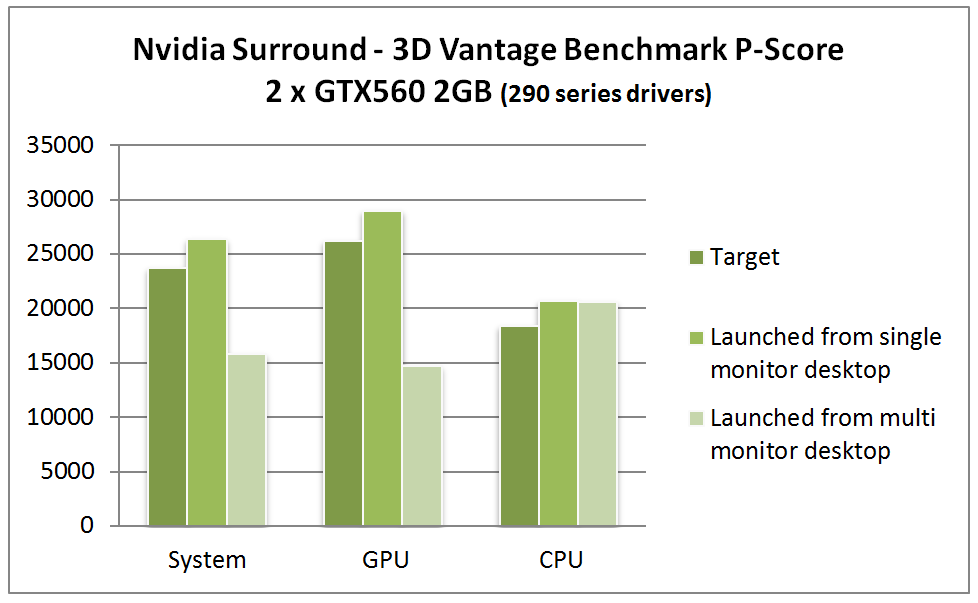
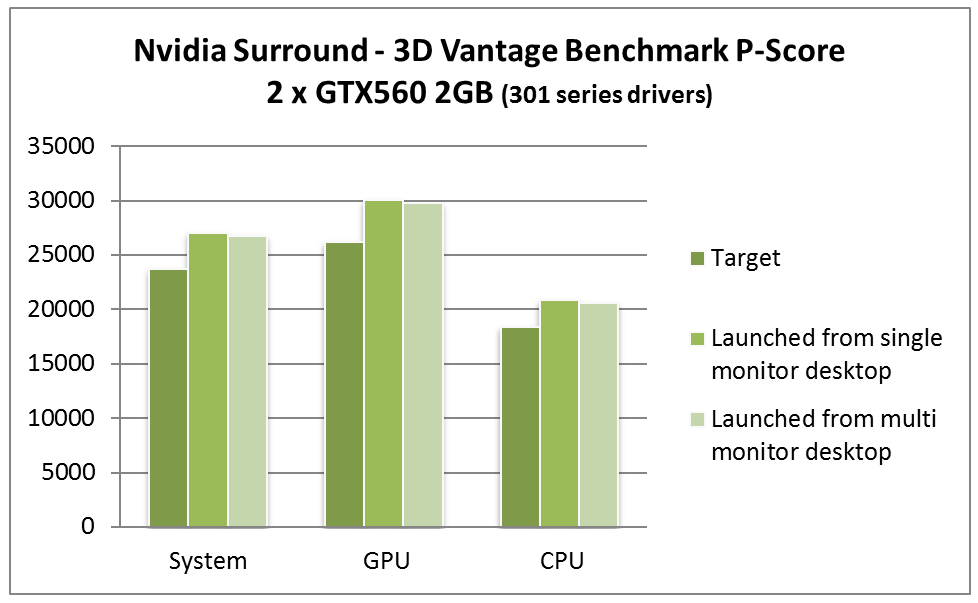
We can clearly see that the performance issue when launching from Surround has now been rectified in the 301 series drivers when compared to the 290 series drivers, as Nvidia claim. This is huge improvement for Nvidia users.
Both the Triplehead2Go Digital Edition and DisplayPort Edition benchmarked the same, so I have only shown one set of results for comparison purposes. The TH2G Digital Edition and DisplayPort Edition performed performed on par with each other, and performed as well as the native surround setups on both the AMD and Nvidia rig.
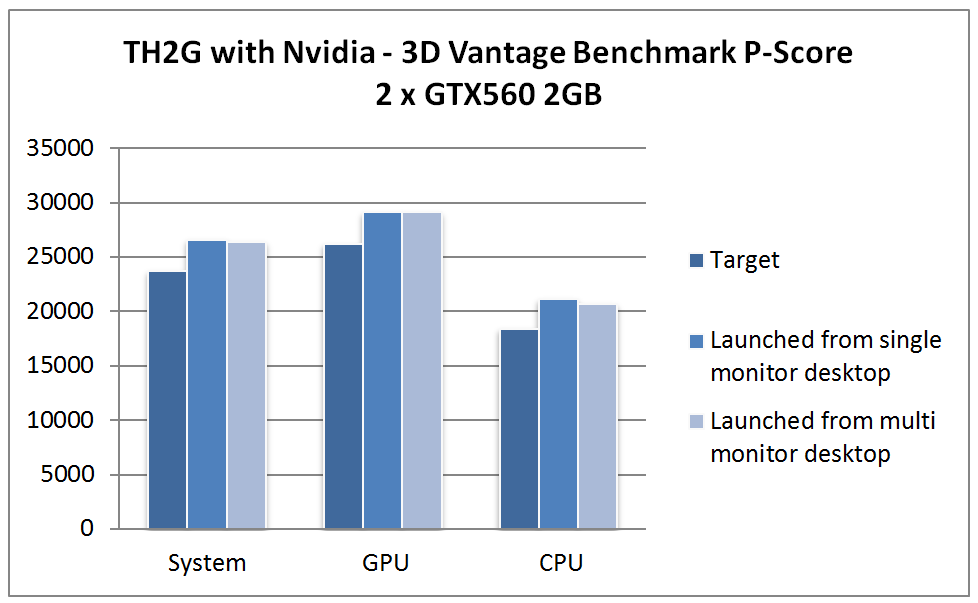
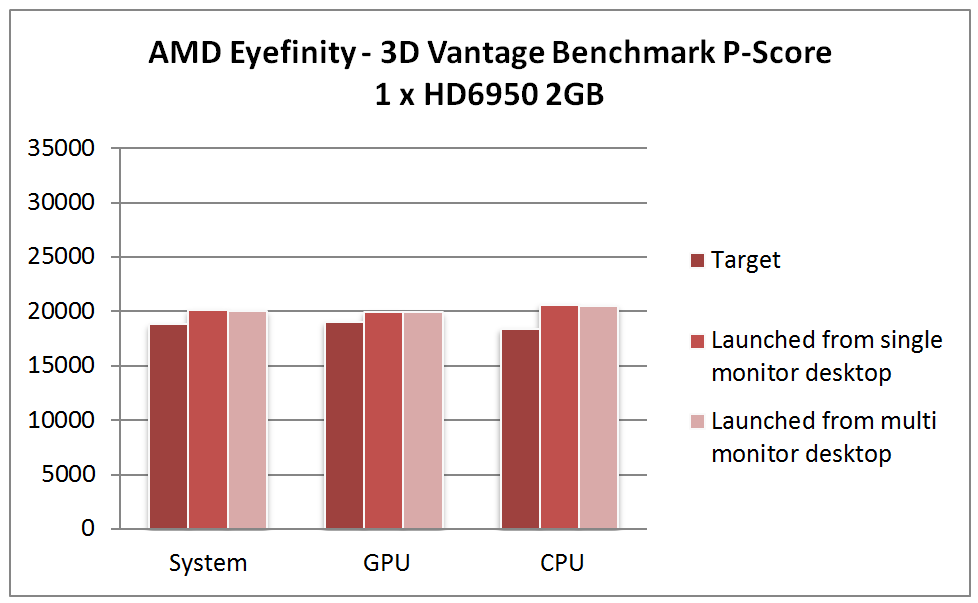
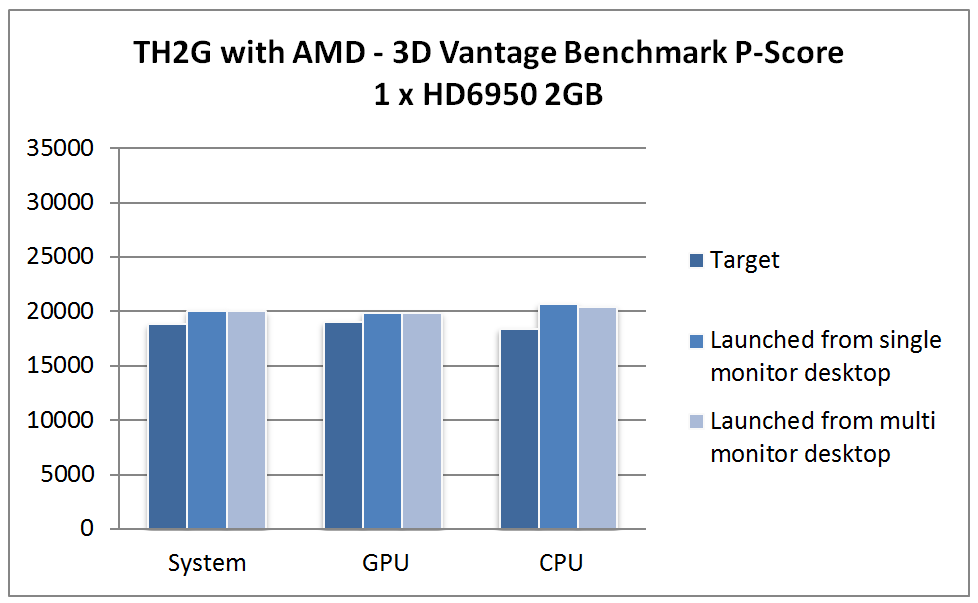
The Eyefinity rig performed worse than the Nvidia counterparts, but the difference in cost will be factored in when assessing this. While I could setup the TH2G on the AMD card with a triple monitor resolution of 3840x800 and benchmark it here, the combination does not allow my native resolution of 5040x1050 and as such was not evaluated any further in this comparison. This held true for both the Digital Edition and DisplayPort edition, so if you own an AMD card and are considering buying a Triplehead2Go, be aware of this.
Do these results translate into real-world figures?