Gaming CPU Shoot-Out Redux: Multi-GPU Scaling - DiRT: Showdown
DiRT: Showdown
DiRT Showdown was tested at the Ultra setting pre-set, with 4X MSAA enabled. The test was run three separate times, with the testing done on the third pass. FRAPS was manually started with the benchmark fly-by of the track. It was subsequently stopped right before the car crossed the finish line, prior to the slow motion scene of the finish.
Please note that the DiRT Showdown test is not a canned demo like Metro Last Light or Unigine Valley. It is a sample race in a figure-eight style track. The cars jockey for position with the driver AI, and each run is inherently different.
Small variances between runs should be discounted, due to this variation between the actual tests. I did toss out any test run that had any crashes or a stuck car.
1080p Widescreen
| DiRT: Showdown - 1080p HD | DiRT: Showdown - 1080p HD CrossFire | |||||||||||||||||||||||||||
| R7 260X | R9 270X | R9 280X | R9 290 | R7 260X CFX | R9 270X CFX | R9 280X CFX | ||||||||||||||||||||||
| Min | Avg | Max | Min | Avg | Max | Min | Avg | Max | Min | Avg | Max | Min | Avg | Max | Min | Avg | Max | Min | Avg | Max | ||||||||
| AMD FX-9590 | 39 | 46.1 | 60 | 53 | 63.2 | 80 | 64 | 76.8 | 96 | 72 | 85.4 | 111 | 71 | 81.9 | 112 | 71 | 84.8 | 124 | 71 | 84.2 | 125 | |||||||
| AMD FX-9370 | 38 | 45.6 | 60 | 51 | 61.0 | 80 | 63 | 77.2 | 97 | 71 | 82.2 | 113 | 63 | 79.0 | 106 | 67 | 81.8 | 121 | 70 | 82.1 | 113 | |||||||
| AMD FX-8350 | 35 | 42.7 | 59 | 47 | 56.4 | 79 | 61 | 73.6 | 99 | 69 | 79.9 | 113 | 64 | 75.7 | 105 | 59 | 78.5 | 117 | 59 | 78.5 | 121 | |||||||
| AMD FX-6350 | 36 | 43.4 | 59 | 47 | 56.4 | 79 | 61 | 73.6 | 99 | 69 | 79.9 | 113 | 59 | 70.7 | 102 | 60 | 72.5 | 105 | 59 | 72.6 | 109 | |||||||
| AMD FX-4350 | 34 | 42.7 | 59 | 44 | 57.1 | 77 | 55 | 63.4 | 96 | 55 | 67.1 | 102 | 48 | 60.8 | 92 | 48 | 60.6 | 92 | 48 | 61.3 | 97 | |||||||
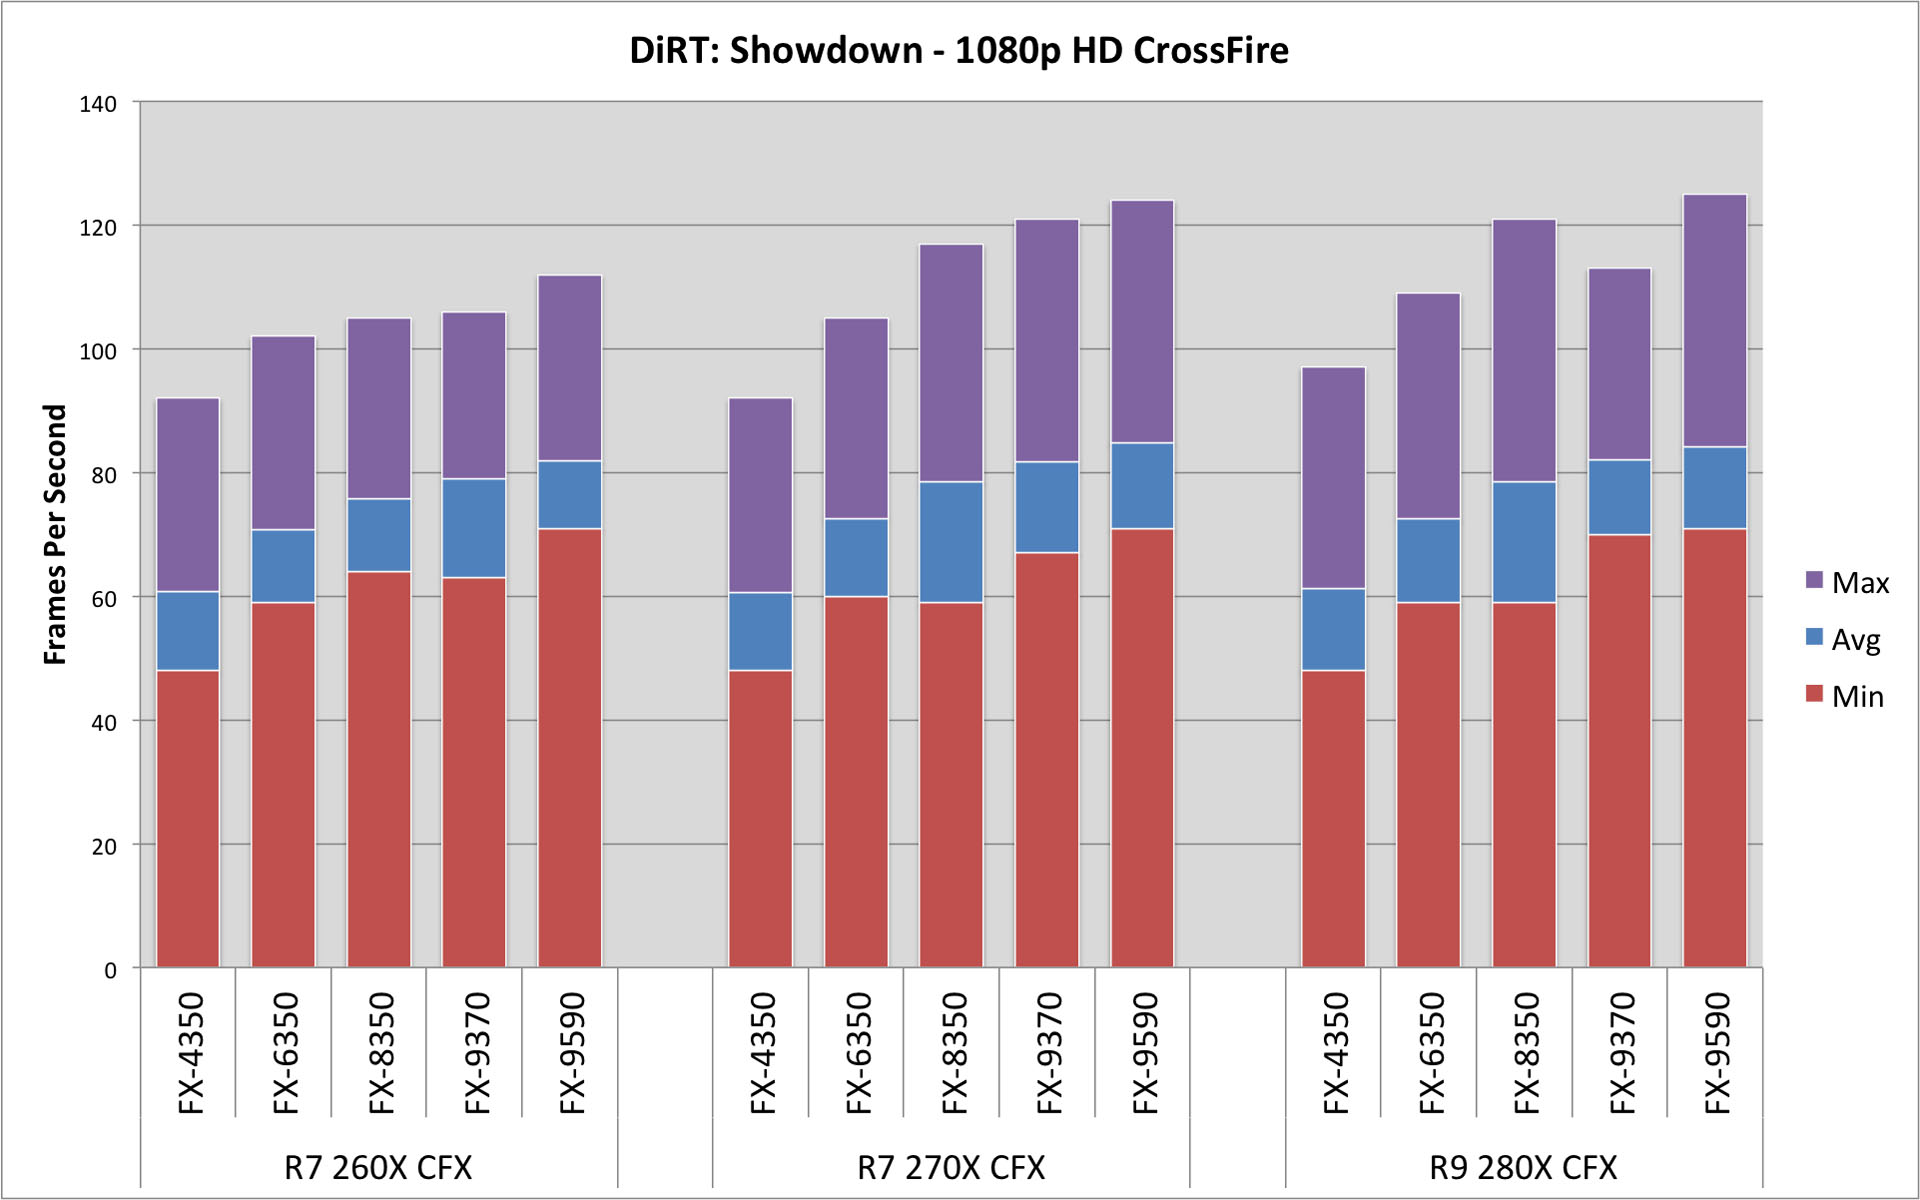
Again, as with the previous article, there is a bit of performance impact on the upper GPUs. We see improvements in averages and minimums across the CPUs, when paired with the R9 280X and especially the R9 290. These are the only instances where a better CPU makes any difference. With the FX-6350, the minimums break the 60fps barrier.

With a CrossFire configuration, there are noticeable increases with each CPU. The FX-4350 continues to be a performance inhibitor. In many instances both the averages and the minimums are above fps. DiRT: Showdown has never been a demanding game, and many of the configurations would benefit from a 120Hz monitor.

1080p Eyefinity
| DiRT: Showdown - Eyefinity | DiRT: Showdown - Eyefinity CrossFire | |||||||||||||||||||||||||||
| R7 260X | R9 270X | R9 280X | R9 290 | R7 260X CFX | R9 270X CFX | R9 280X CFX | ||||||||||||||||||||||
| Min | Avg | Max | Min | Avg | Max | Min | Avg | Max | Min | Avg | Max | Min | Avg | Max | Min | Avg | Max | Min | Avg | Max | ||||||||
| AMD FX-9590 | 17 | 20.4 | 29 | 25 | 29.5 | 41 | 34 | 39.9 | 53 | 39 | 45.3 | 61 | 32 | 38.3 | 53 | 46 | 52.9 | 72 | 62 | 71.4 | 94 | |||||||
| AMD FX-9370 | 17 | 20.5 | 29 | 26 | 29.6 | 41 | 35 | 40.3 | 53 | 39 | 44.9 | 61 | 32 | 38.2 | 54 | 44 | 52.3 | 73 | 60 | 70.5 | 94 | |||||||
| AMD FX-8350 | 16 | 20.0 | 28 | 22 | 27.4 | 39 | 32 | 39.3 | 54 | 39 | 45.7 | 62 | 31 | 37.4 | 51 | 46 | 53.2 | 74 | 60 | 69.7 | 94 | |||||||
| AMD FX-6350 | 15 | 19.9 | 28 | 23 | 27.2 | 39 | 30 | 39.0 | 54 | 39 | 45.3 | 62 | 30 | 37.3 | 51 | 45 | 52.4 | 74 | 56 | 65.9 | 91 | |||||||
| AMD FX-4350 | 16 | 19.9 | 29 | 22 | 27.5 | 39 | 31 | 38.7 | 54 | 38 | 45.2 | 62 | 17 | 20.3 | 30 | 43 | 50.0 | 69 | 43 | 56.4 | 89 | |||||||
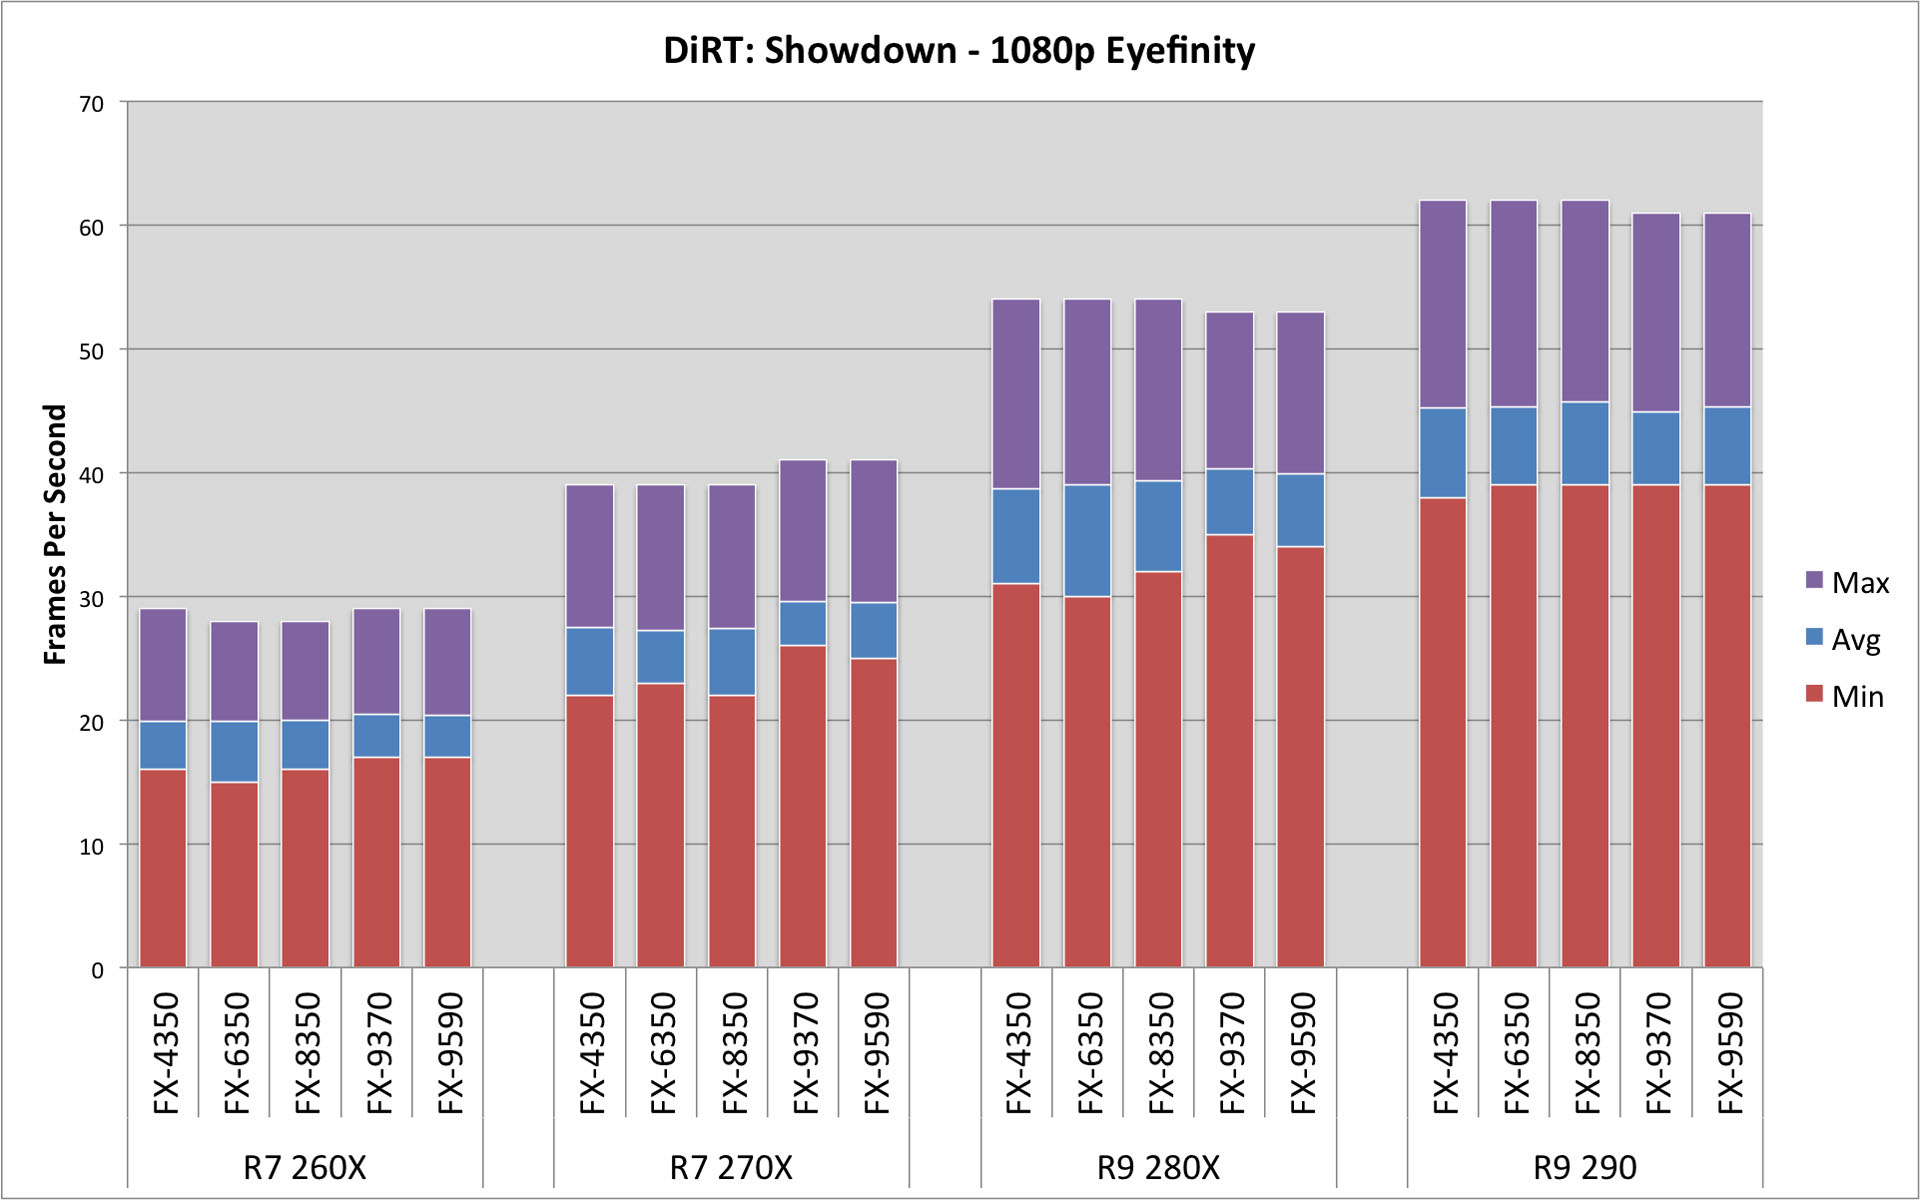
As with the previous article, the results across each CPU is basically flat. Even looking at the minimums and maximums, the variations are within the margin of error.

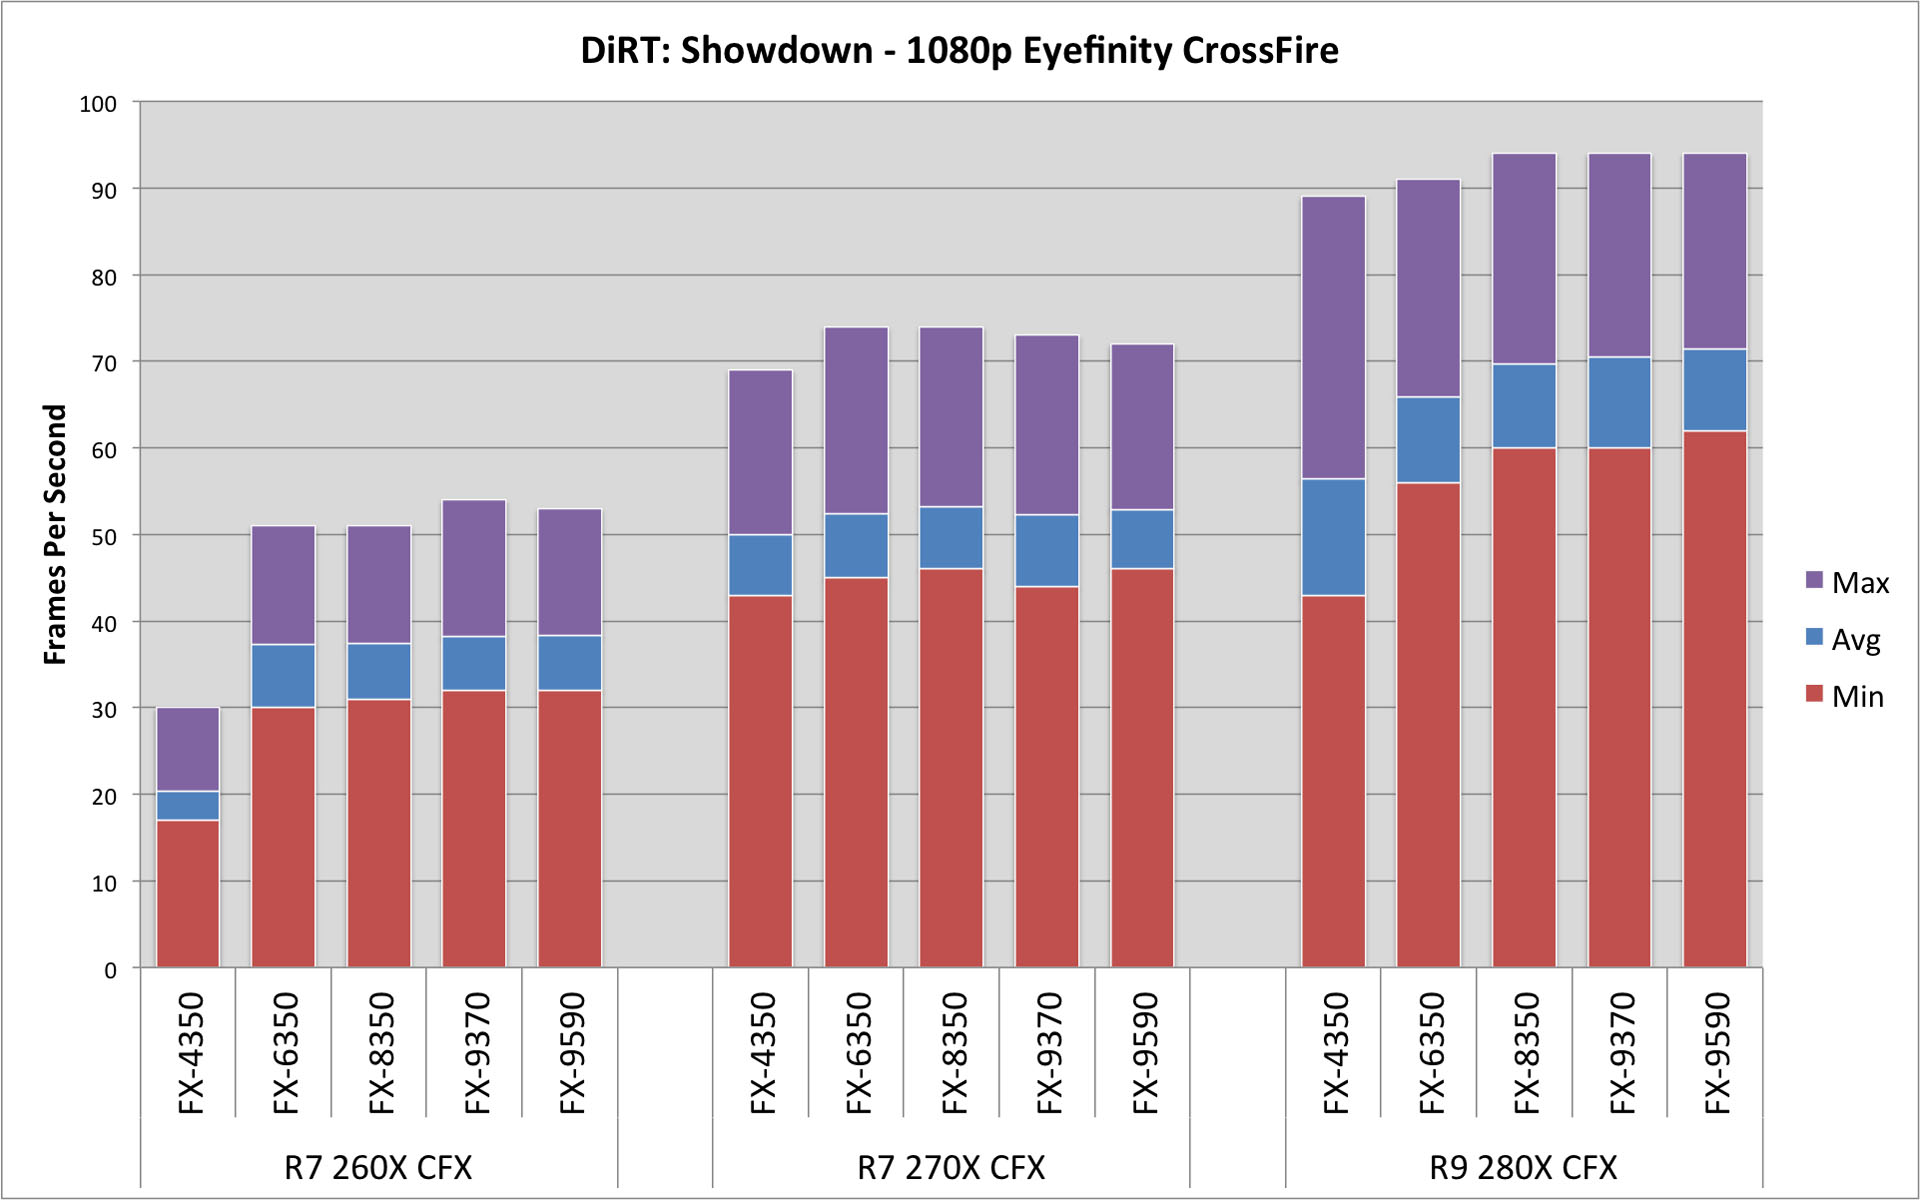
With CrossFire, we do see some performance improvements with a pair of R9 280X cards. The FX-4350 does hamper performance, especially on the R7 260X. The FX-4350 carries parity with the other CPUs with the pair of R7 270X. Even the max frame rate with the R9 280X is on par with the other CPUs. However, the minimum and average scores are much lower.
