Gaming CPU Shoot-Out Redux: Multi-GPU Scaling - Metro Last Light
Metro Last Light
For Metro Last Light I used the be built-in benchmarking tool. The test was run at "Very High" quality, with AF 16X texture filtering, Low motion blur and Normal tessellation. I run these settings on the benchmark run for three loops. I used FRAPS to capture the performance data of the third and last loop.
1080p Widescreen
| Metro Last Light - 1080p HD | Metro Last Light - 1080p HD CrossFire | |||||||||||||||||||||||||||
| R7 260X | R9 270X | R9 280X | R9 290 | R7 260X CFX | R9 270X CFX | R9 280X CFX | ||||||||||||||||||||||
| Min | Avg | Max | Min | Avg | Max | Min | Avg | Max | Min | Avg | Max | Min | Avg | Max | Min | Avg | Max | Min | Avg | Max | ||||||||
| AMD FX-9590 | 20 | 28.0 | 44 | 27 | 40.4 | 65 | 34 | 54.5 | 90 | 44 | 68.0 | 99 | 29 | 44.0 | 67 | 37 | 58.1 | 87 | 40 | 69.8 | 108 | |||||||
| AMD FX-9370 | 19 | 28.1 | 44 | 27 | 40.4 | 66 | 34 | 54.9 | 91 | 44 | 68.0 | 98 | 28 | 43.7 | 67 | 36 | 57.8 | 85 | 37 | 68.7 | 104 | |||||||
| AMD FX-8350 | 18 | 27.1 | 43 | 25 | 36.9 | 60 | 34 | 53.0 | 84 | 39 | 66.8 | 96 | 28 | 41.2 | 66 | 36 | 57.3 | 87 | 35 | 68.2 | 111 | |||||||
| AMD FX-6350 | 17 | 27.0 | 43 | 25 | 36.9 | 60 | 29 | 52.5 | 82 | 37 | 64.2 | 96 | 21 | 35.9 | 55 | 30 | 55.6 | 82 | 29 | 62.9 | 101 | |||||||
| AMD FX-4350 | 18 | 27.1 | 43 | 23 | 36.1 | 59 | 23 | 49.5 | 75 | 24 | 53.1 | 80 | 18 | 37.5 | 54 | 18 | 45.2 | 71 | 23 | 47.2 | 74 | |||||||
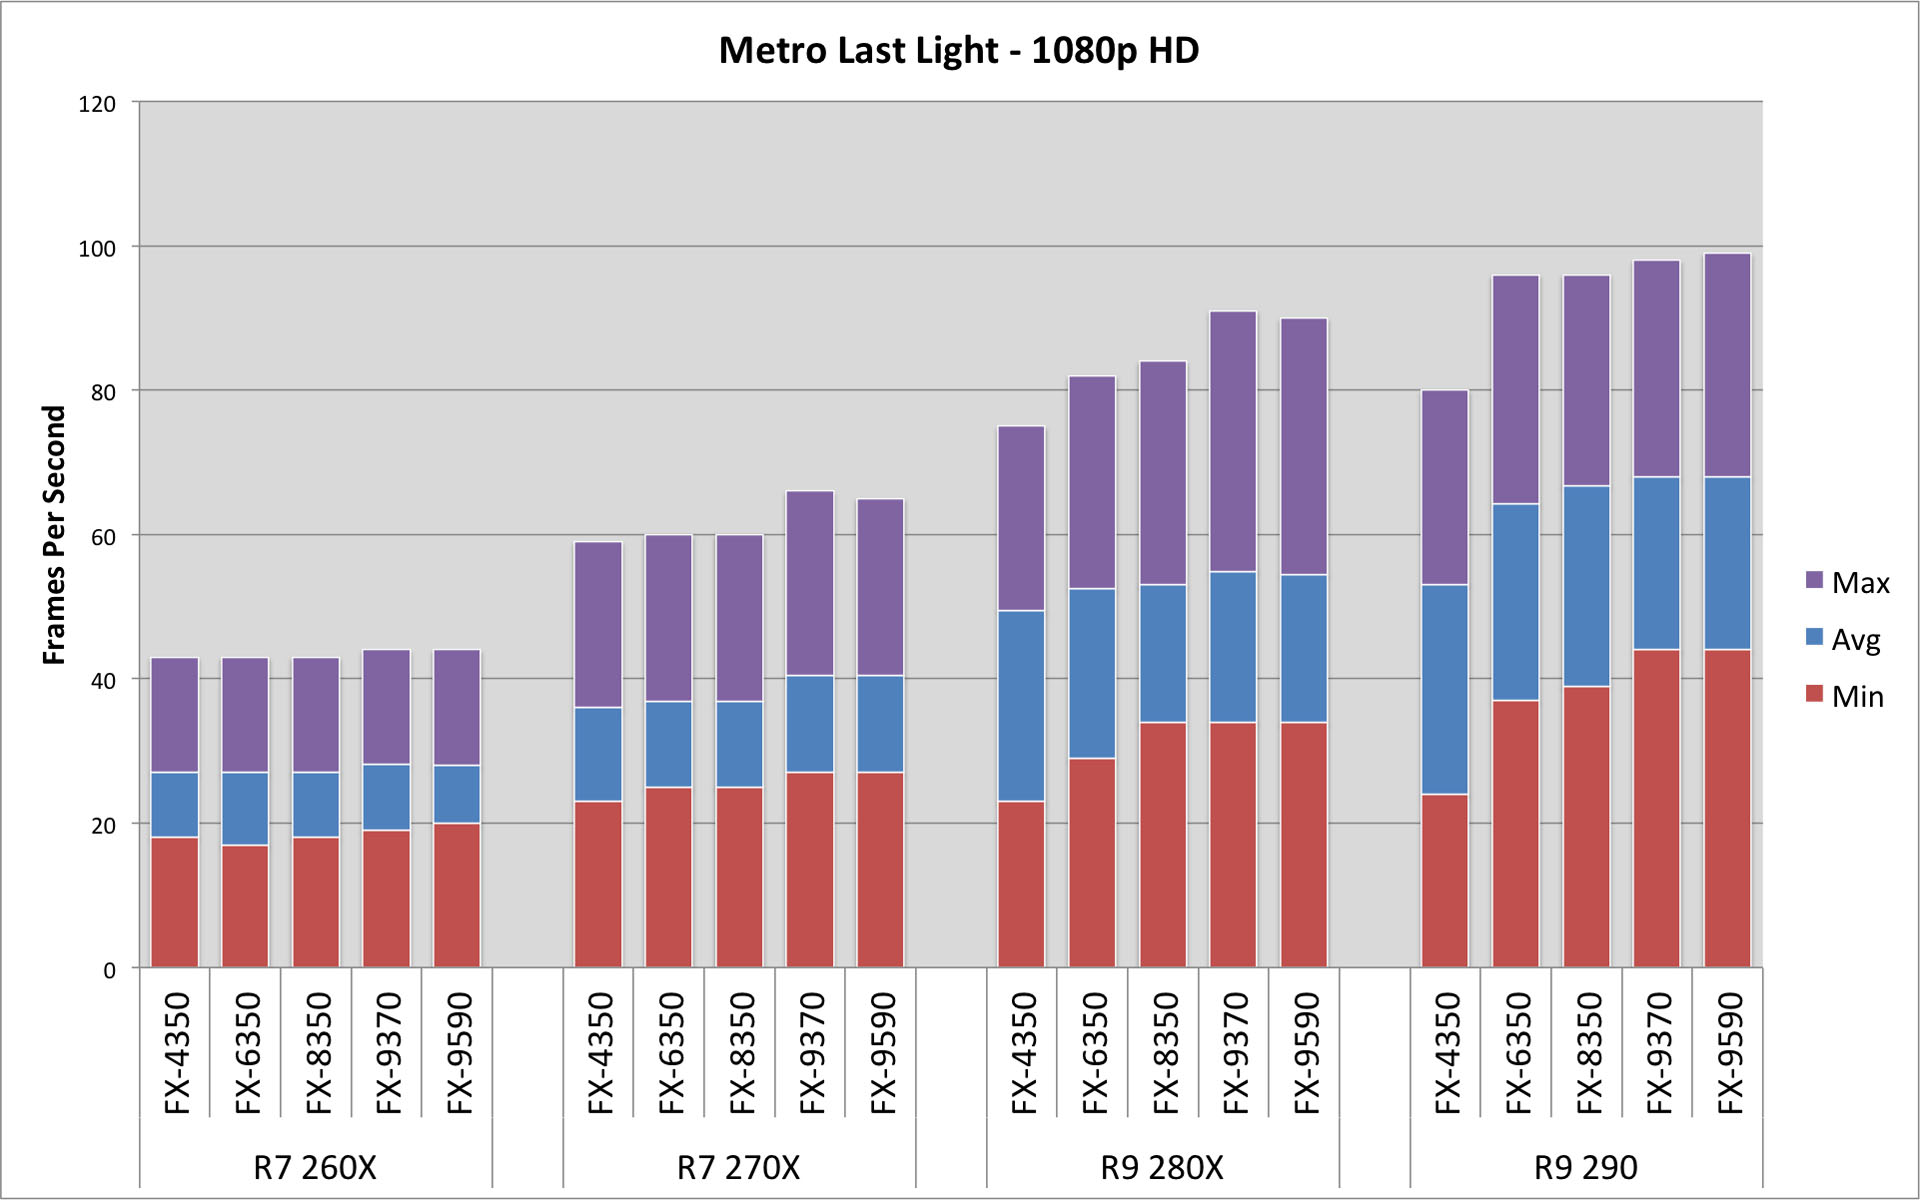
In single GPU configurations, an R7 290X is needed for the average to stay above 30fps. All of the processors basically allow for a max of 60fps. The R9 290 is needed for an average of 60fps. With the R9 280X and the R9 290, you can see the performance improve steadily with each processor.

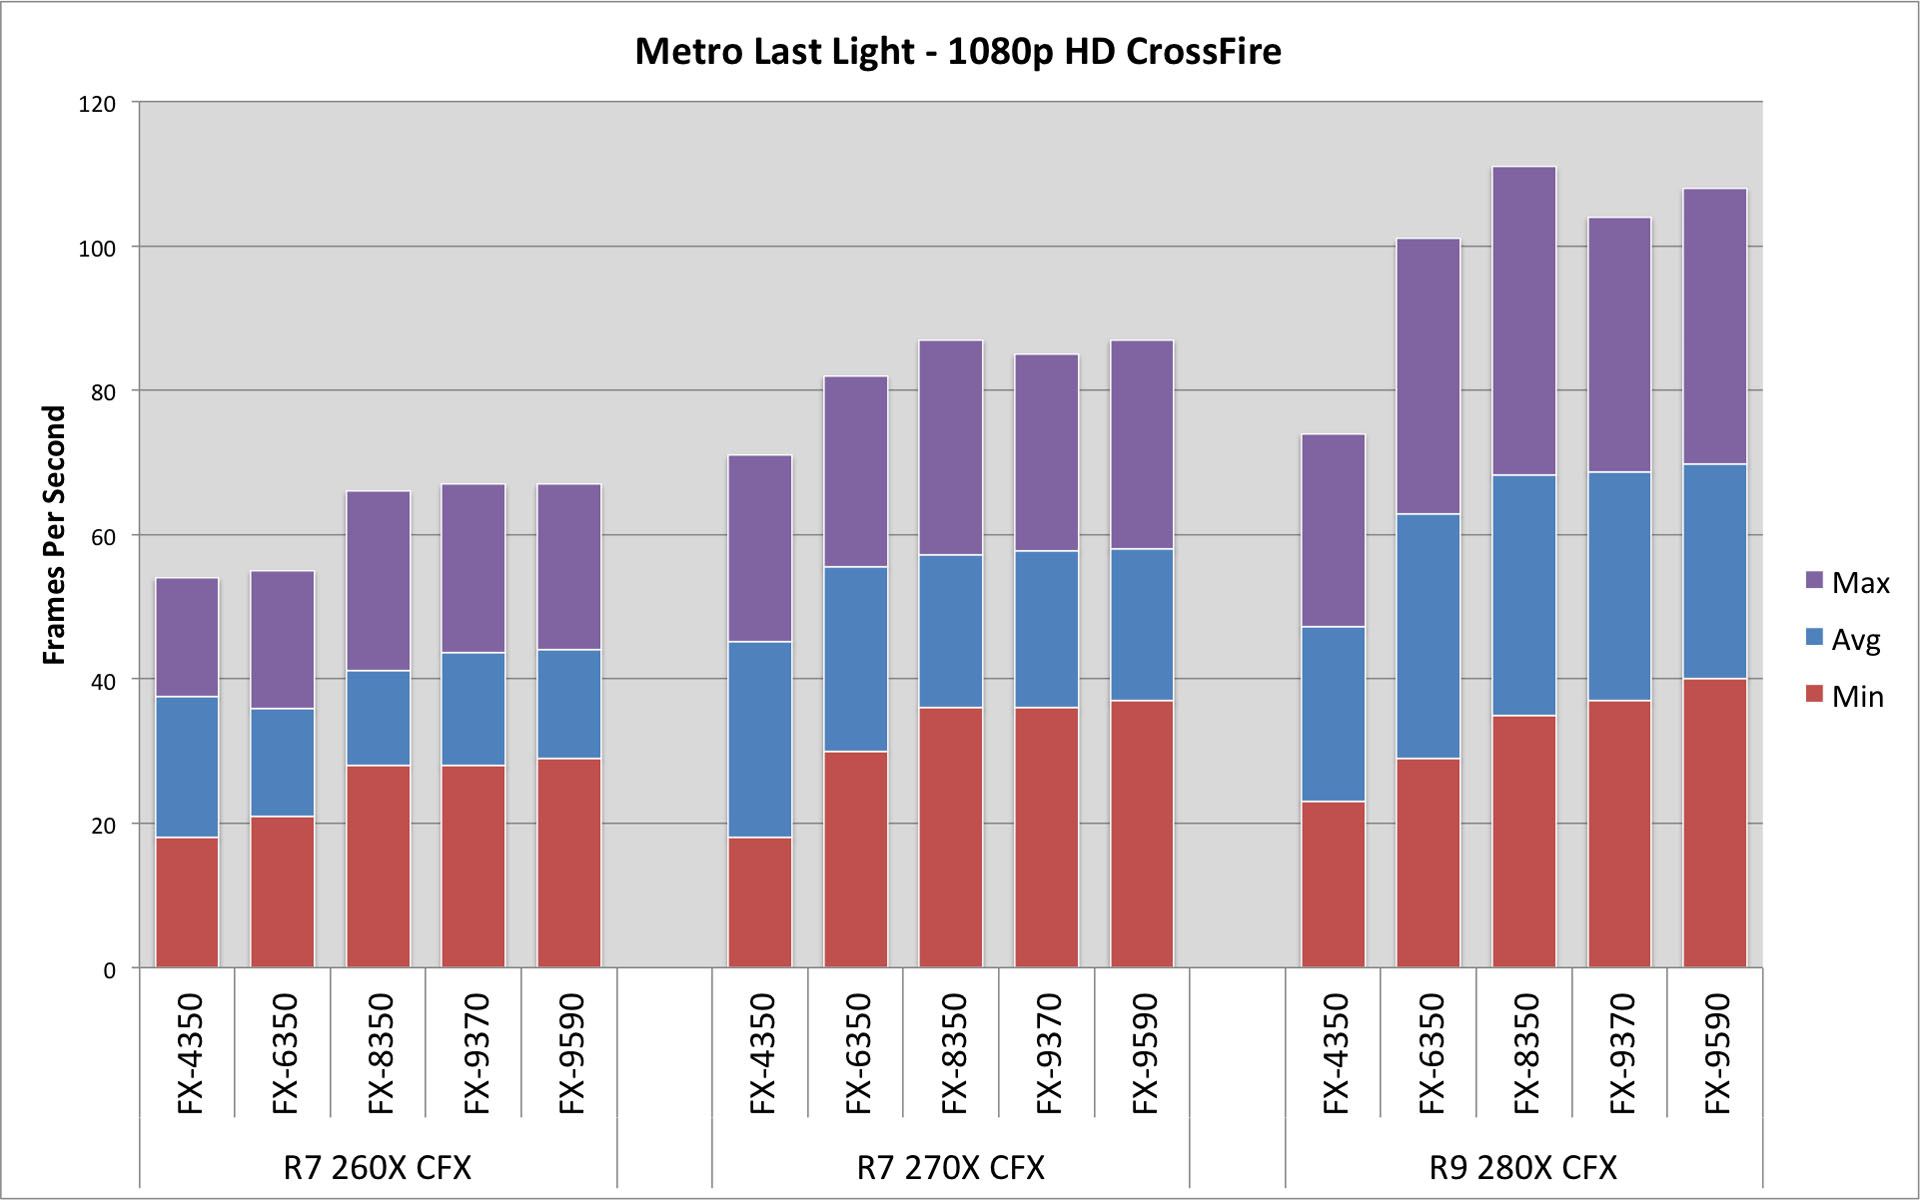
In CrossFire, the FX-4350 holds back performance - especially with a pair of R9 280X cards. Assuming you have the funds to run a pair of those, I would assume a better CPU is already on your radar. There are marked improvements for an FX-8350 in each configuration, with the two faster chips not offering any better (and sometimes worse) performance.

1080p Eyefinity
| Metro Last Light - Eyefinity | Metro Last Light - Eyefinity CrossFire | |||||||||||||||||||||||||||
| R7 260X | R9 270X | R9 280X | R9 290 | R7 260X CFX | R9 270X CFX | R9 280X CFX | ||||||||||||||||||||||
| Min | Avg | Max | Min | Avg | Max | Min | Avg | Max | Min | Avg | Max | Min | Avg | Max | Min | Avg | Max | Min | Avg | Max | ||||||||
| AMD FX-9590 | 7 | 11.2 | 16 | 11 | 16.8 | 24 | 18 | 24.9 | 36 | 23 | 30.7 | 44 | 9 | 18.6 | 30 | 18 | 27.2 | 42 | 26 | 40.0 | 63 | |||||||
| AMD FX-9370 | 7 | 11.1 | 16 | 11 | 16.9 | 24 | 18 | 24.8 | 36 | 24 | 30.8 | 44 | 11 | 18.5 | 30 | 18 | 27.1 | 42 | 26 | 39.7 | 62 | |||||||
| AMD FX-8350 | 7 | 11.1 | 16 | 10 | 15.3 | 22 | 16 | 24.1 | 36 | 22 | 30.0 | 43 | 10 | 16.8 | 27 | 17 | 25.9 | 39 | 26 | 38.7 | 62 | |||||||
| AMD FX-6350 | 7 | 11.0 | 16 | 9 | 15.3 | 22 | 16 | 24.2 | 36 | 22 | 30.3 | 43 | 11 | 17.9 | 55 | 18 | 26.3 | 40 | 26 | 38.8 | 62 | |||||||
| AMD FX-4350 | 8 | 11.0 | 16 | 10 | 15.3 | 22 | 16 | 23.8 | 35 | 18 | 30.4 | 44 | 8 | 16.1 | 27 | 16 | 25.0 | 38 | 15 | 34.8 | 53 | |||||||
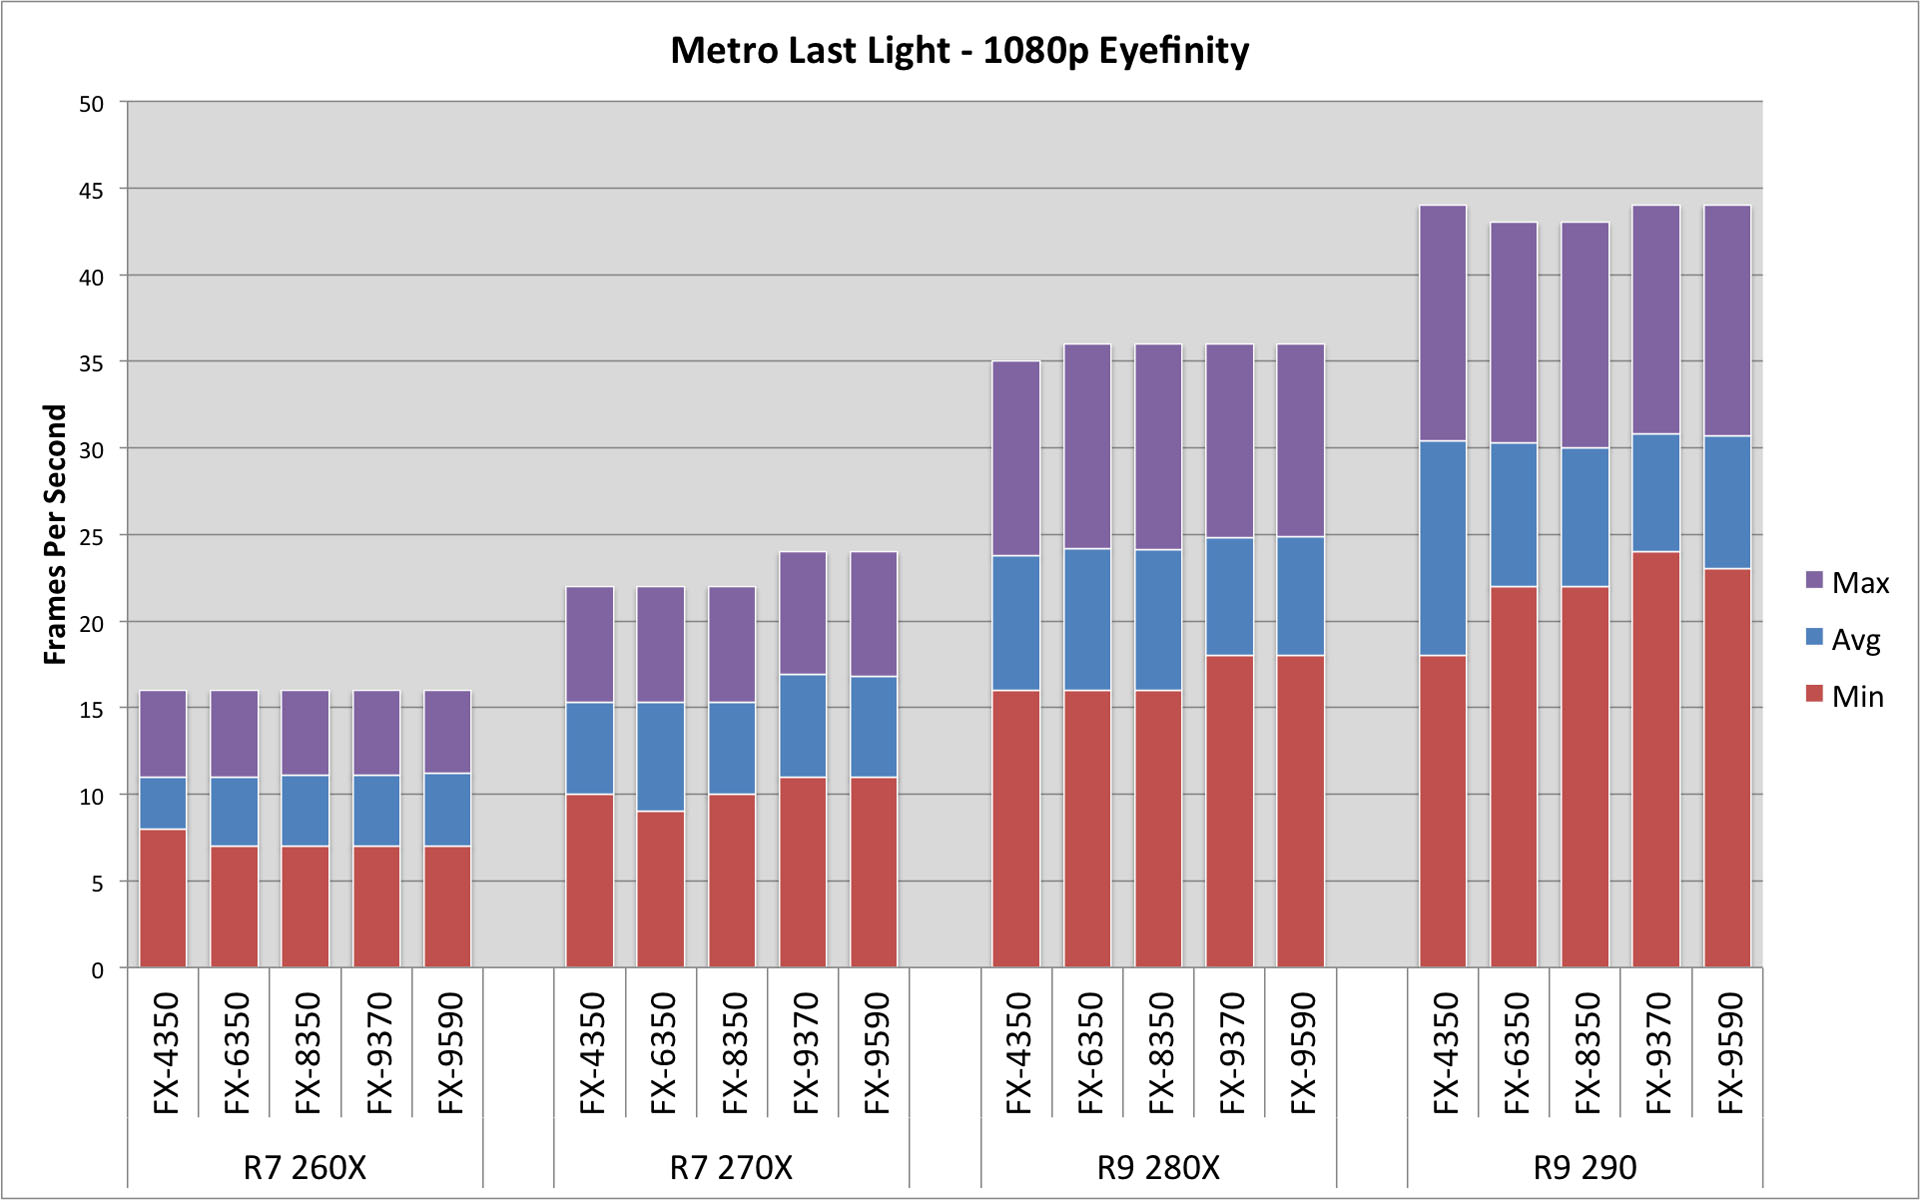
As we saw in the previous article, Eyefinity performance on a single GPU is absolutely tied to the GPU. Average and max frames are basically in a dead heat across all the configurations, with the only improvements being 1-2 fps. There are some noticeable improvements in minimum fps produced with a better CPU - but only on an R9 290.

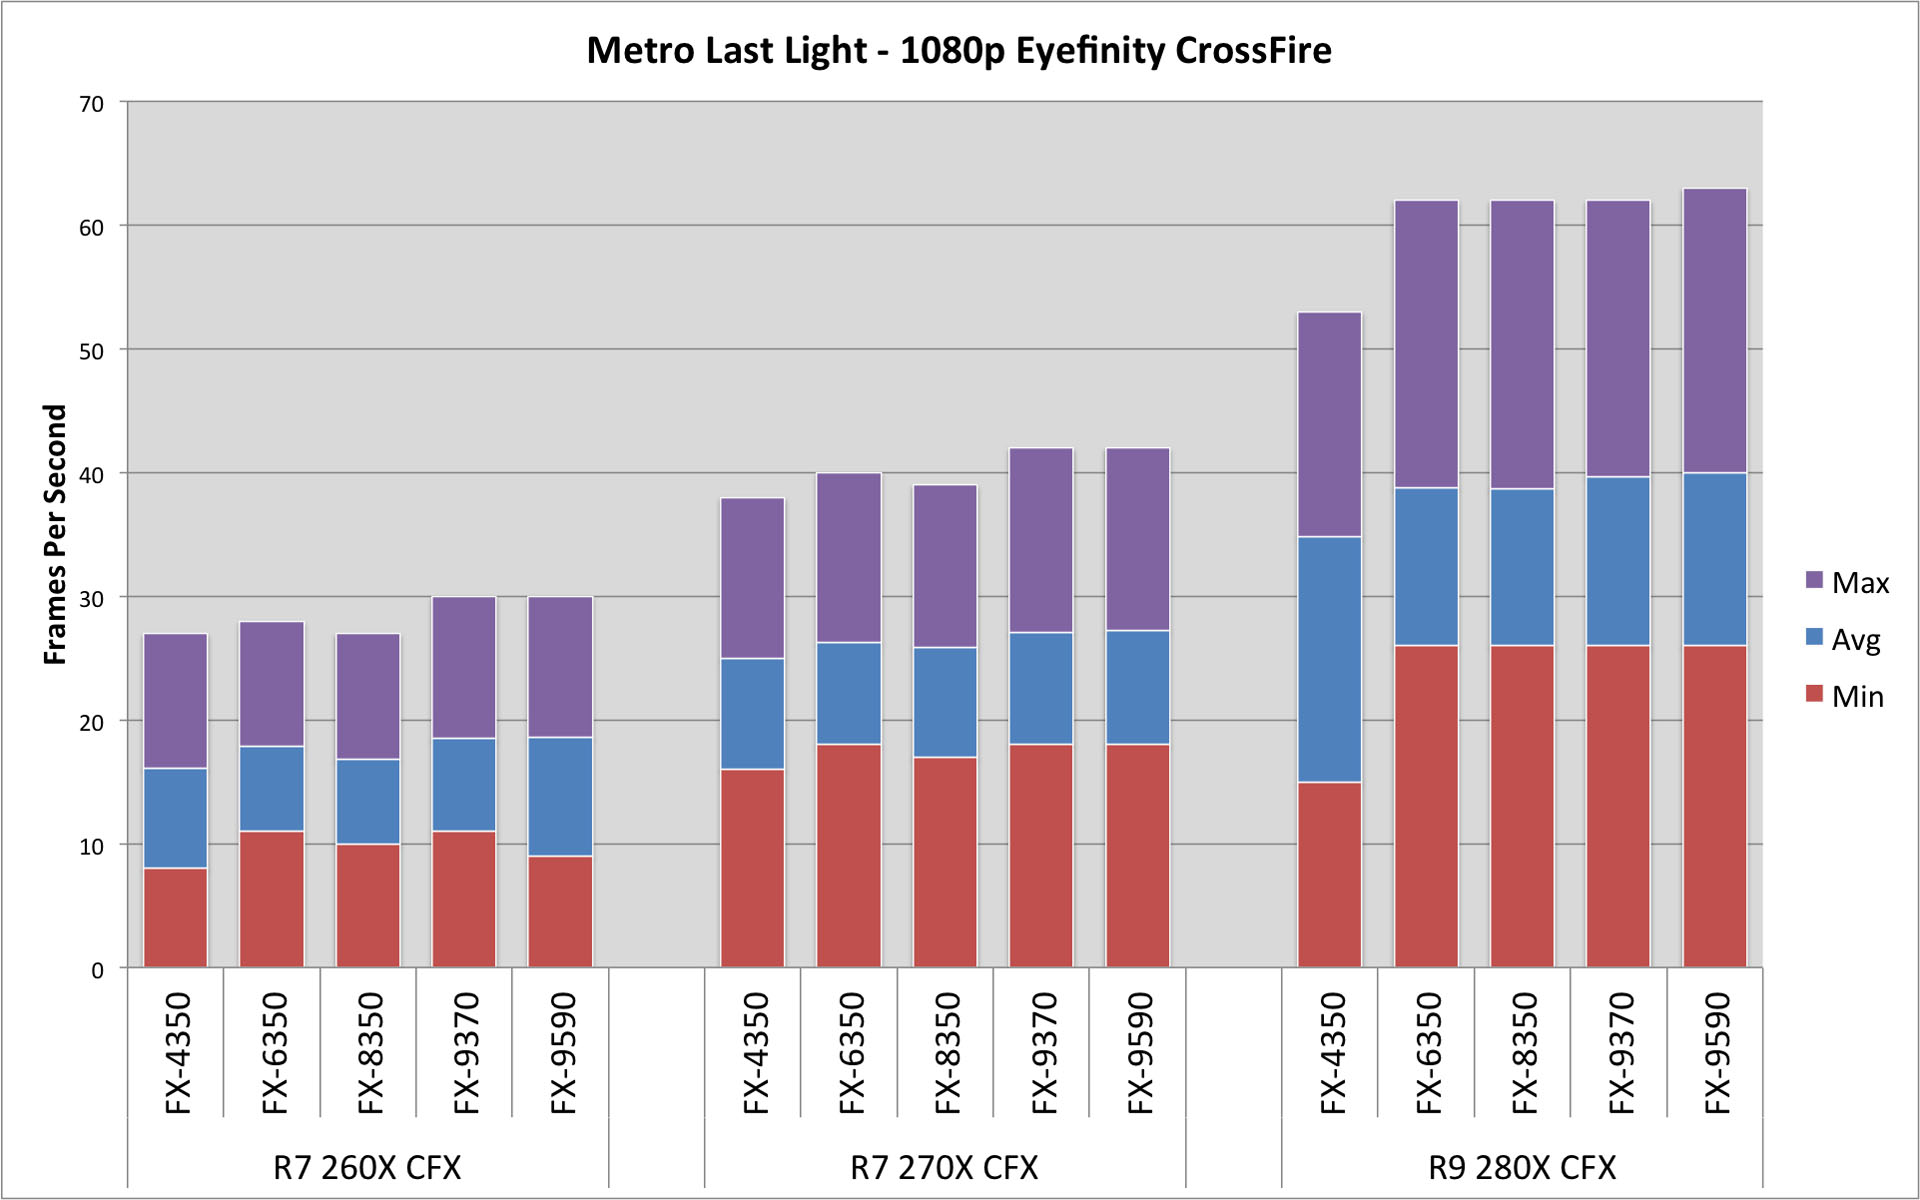
CrossFire is largely the same story - performance is tied to the GPU. The one stand out difference is the FX-4350 with a pair of R9 280X cards. The low end CPU certainly holds back the power of the cards. But on the other hand, the higher end CPUs don't offer any performance gains over each other.

